U2 Data Analytics
an analytical & musical journey
Hans van Leeuwen © November 2024
Why Analyze U2’s Tours?
- A long-time U2 fan and data science & strategy professional
- Provide a data-informed view on setlist variability
- Highlight global impact across five decades
“We thought that we had the answers
It was the questions we had wrong”
∼ 11 O’Clock Tick Tock, U2, 1980
Behind the Data
- Data Sources:
- u2gigs.com: concert details
- Supplementary geo-data for world maps
- Preparation & Processing:
- Web-scraping and data management
- Standardizing formats
- Fixing inconsistencies
Project development, code & data repositories, deployment and publishing
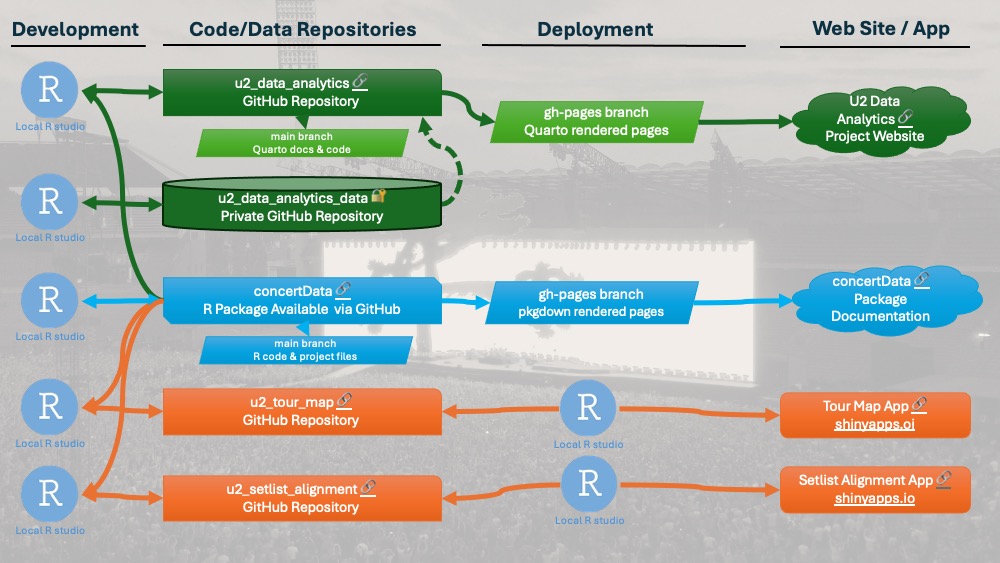
Wipe / arrow down for more detail on the captured data
Data Structure
- showID: the ID for this show as used on u2gigs.com
- tour: the name of the U2 tour the show was part of (e.g. U2 ZOO TV Tour)
- leg: the name of the tour leg the show was part of (e.g. ZOO TV 1st leg: North America)
- date: the date when the show took place
- venue: the name of the stadium, arena, pub, school or other type of venue where the concert took place (e.g Madison Square Garden)
- city: the city where the show took place (e.g New York)
- state: the state where the show took place (e.g New York)
- country: the country where the show took place (e.g USA)
- song_position: the position in the show set list when this song was played (e.g. 1 for the opening song)
- snippet: a boolean indicating if this was a regular song, or if it was just a song snippet inserted before or after a regular song (e.g. TRUE or FALSE)
- encore: a boolean indicating if this song was played in the main set list or in the encore, after the band took a short break (e.g. TRUE or FALSE)
- song_title: the title of the song (e.g. Sunday Bloody Sunday)
- show_url: the URL to the show info on u2gigs.com
- song_url: the URL to the song info on u2gigs.com
- song_lyrics: the lyrics of the song (e.g. ‘I can’t believe the news today, I can’t close my eyes and make it go away…..’)
U2 by the Numbers
- 2000+ Concerts
- 13 Major Tours
- 900+ Unique Songs Performed
- 7,300,000 people attended their 110 360° Tour concerts
- 22 Grammy Awards
- 4 band members
- Active since 1976
Setlist Dynamics
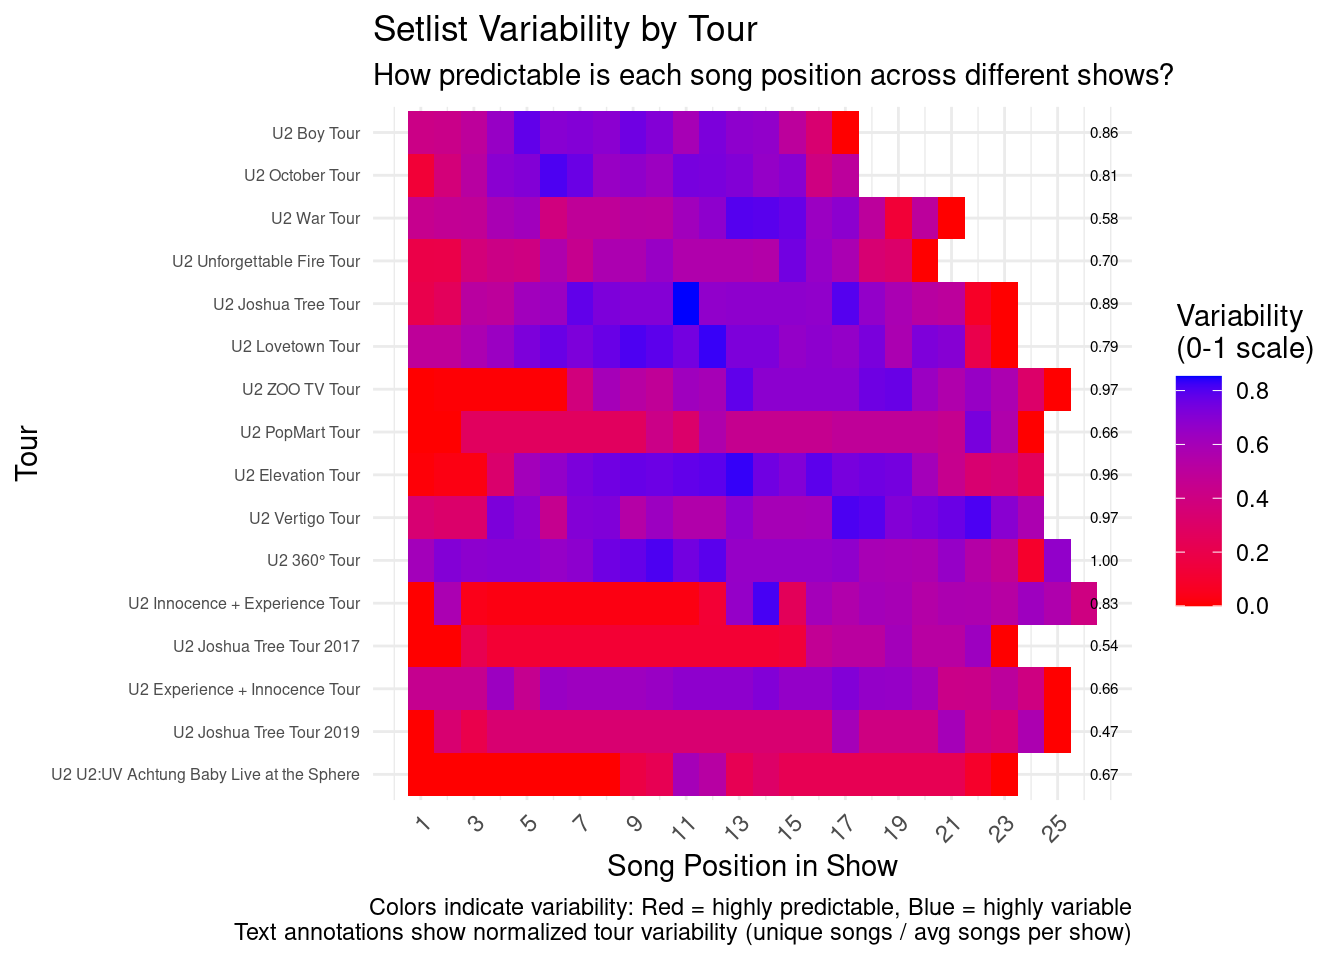
- A topic very often discussed by U2 fans: setlist variability
- ‘They really mixed it up last night!’
- This view allows for a more data-driven and objective discussion
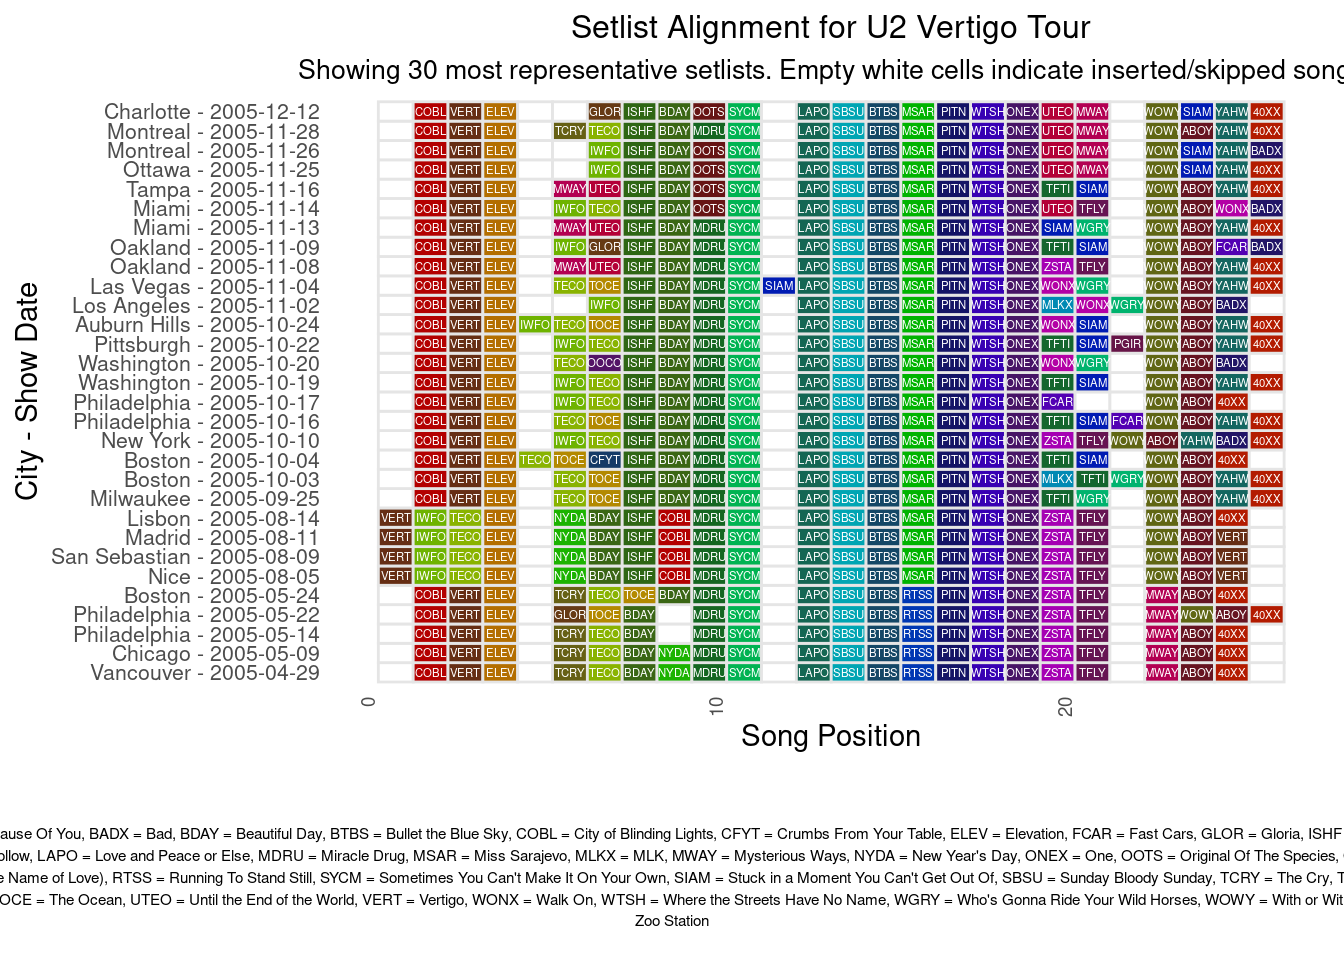
Exploring Patterns in Setlists
- What are the common, conserved blocks of songs in a tour?
- When in the show do they mix it up more?
- Clusters of concerts with similar setlists
- Coloring by tour leg
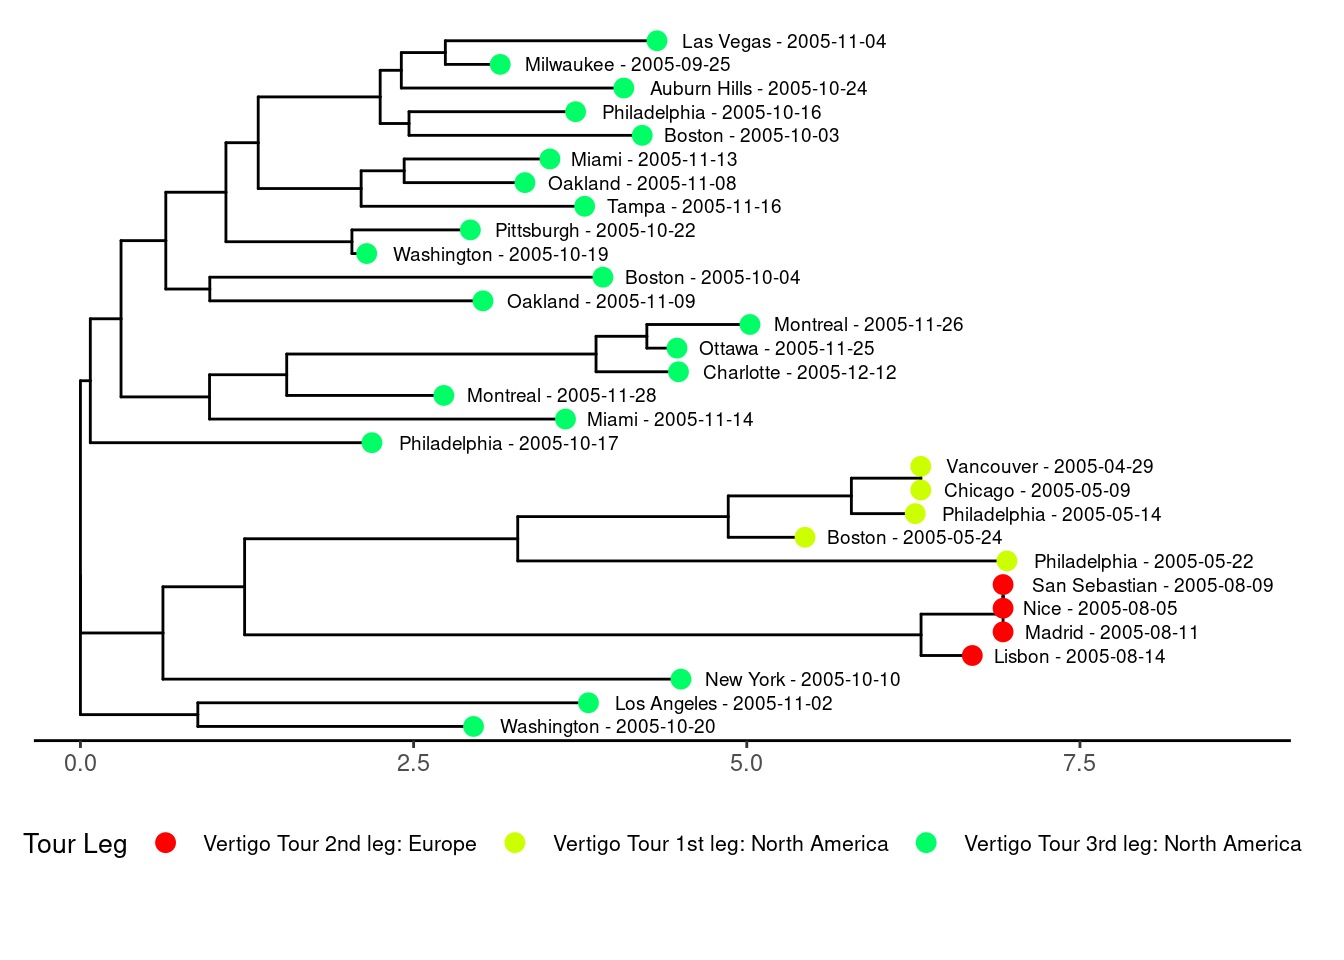
Wipe / arrow down to see the R code that generated the distance tree
Distance Tree Code
# required libraries
library(dplyr)
library(seqinr)
library(ape)
library(ggplot2)
library(ggtree)
# load my custom library
devtools::install_github("vanleeuwen-hans/concertData")
library(concertData)

# read the u2 concert data
u2data <- read_concertData_csv('u2data/u2data_all_shows_clean_final.csv')

# Filter for specific tour
tour_data <- u2data[u2data$tour == "U2 Vertigo Tour", ]
# Remove snippets
no_snippets_data <- concertData_remove_snippets(tour_data)
# Remove shows with no setlist
filtered_data <- concertData_remove_showsNoSetlist(no_snippets_data)

# Get a data frame from the mafft clustal output (code to create that is elsewhere)
alignment_data <- read_mafft_clustal_alignment("mafft/u2_setlists_mafft_alignment.ASCII")
# Convert data frame to list which is needed for downstream distance tree analysis
sequences <- setNames(as.list(alignment_data$sequence), paste0("showID", alignment_data$showID))

# Calculate distance matrix
dist_matrix <- calculate_distance_matrix(sequences)
# Convert to dist object
setlist_dist <- as.dist(dist_matrix)
# Construct the tree
setlist_tree <- nj(setlist_dist)

# Collect show info
show_info <- unique(filtered_data[, c("showID", "city", "date", "country", "leg")])
show_info$city_date <- paste(show_info$city, format(show_info$date, "%Y-%m-%d"), sep = " - ")

# create tree labels in the format 'City YYYY-MM-DD'
new_labels <- create_city_date_tree_labels(filtered_data, setlist_tree, show_info)
# Modify tree labels
setlist_tree$tip.label <- new_labels

# create standard tree plot
tree_plot <- create_ggtree_plot(setlist_tree)
# Display the plot
print(tree_plot)

# Create the tree plot with colors based on country
plot_country <- create_ggtree_plot_colored(setlist_tree, show_info, color_by = "country")
print(plot_country)

# Create the tree plot with colors based on leg
plot_leg <- create_ggtree_plot_colored(setlist_tree, show_info, color_by = "leg")
print(plot_leg)Experience the Data
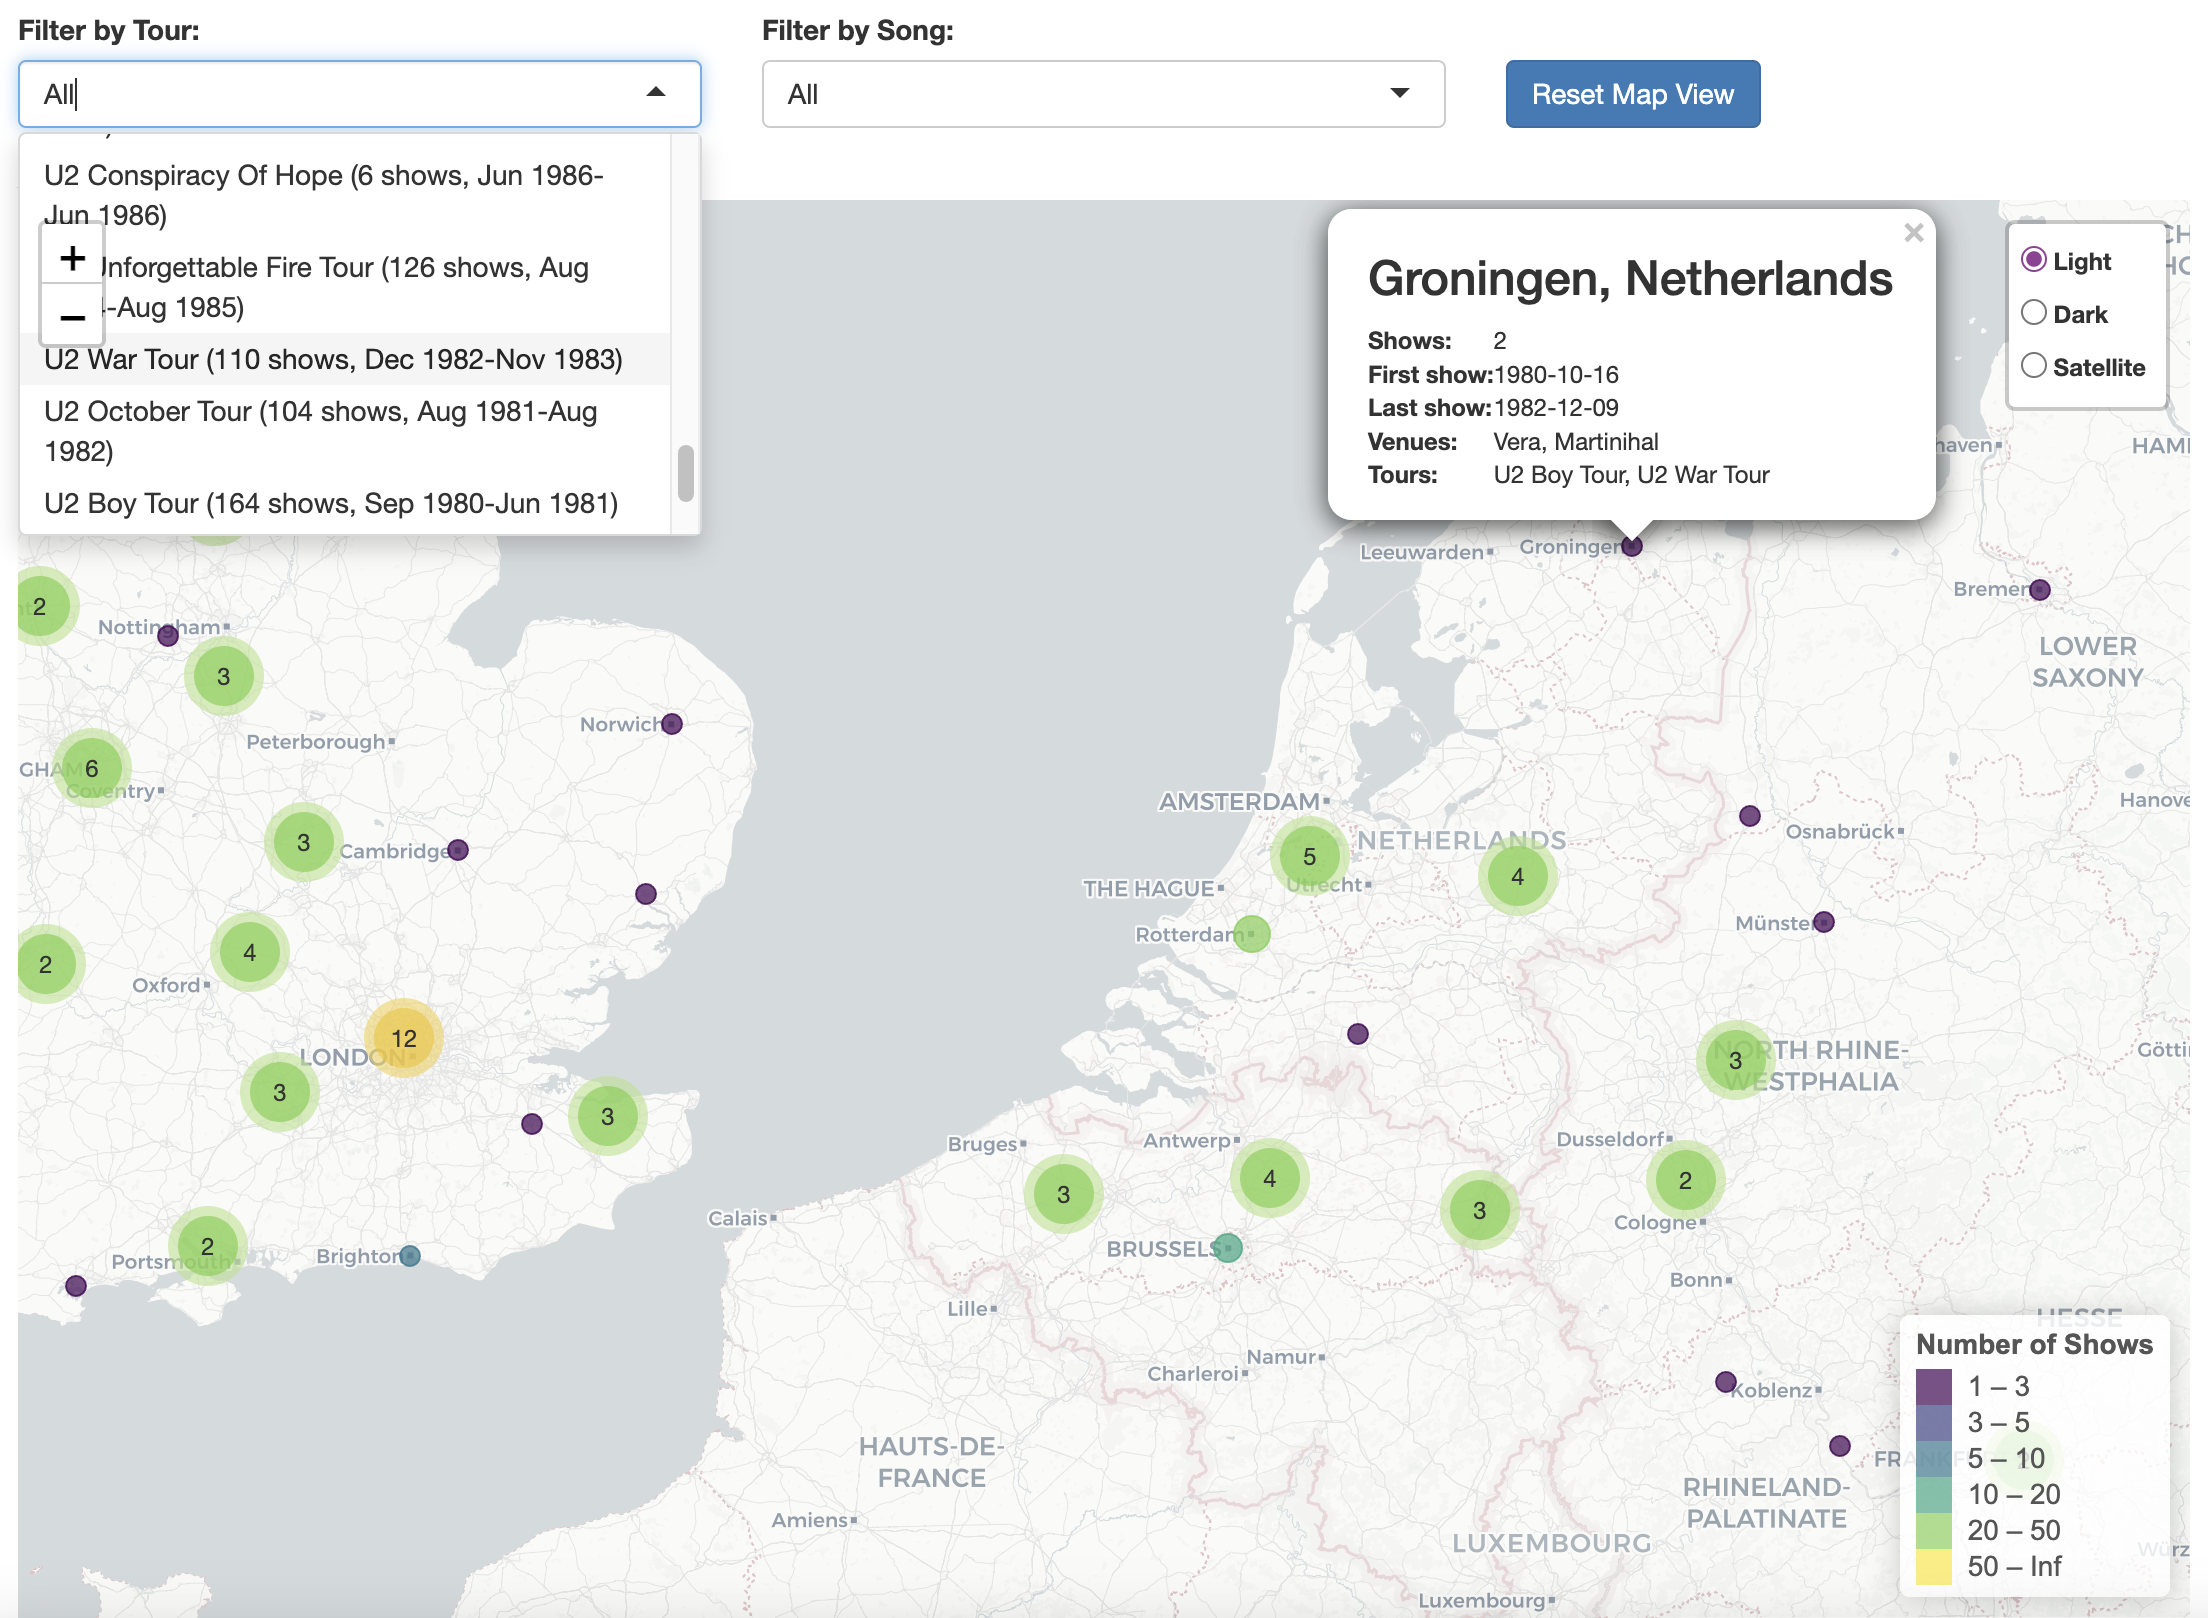
- Interactive Shiny App: U2 Tour Map
- an interactive version of the world map so that one can:
- filter by tour and/or song,
- zoom in/out,
- see details for each city.
Lessons Learned
- Data Preparation
- Knowing the data is key for the ability to judge the outcome of the code
- Standardizing data types and fixing inconsistencies and errors
- Analyses and visualization
- Combining tools (e.g. R, Shiny, bash command-line, Quarto, GitHub) creates a powerful and inspiring environment to extract knowledge and insights from data
- Generative AI Support
- Leveraging GenAI for project ideation, code writing/debugging, advising on tools, visuals and platforms, co-designing data management set-up and code deployment strategies
- Importance of clear prompts, check for hallucinations and knowing its limits
- Data Analytics is Fun
- I thoroughly enjoyed this Capstone Project of the Google Data Certification!
Acknowledgements
- Matt from u2gigs.com - comprehensive historical concert data
- My wife - valuable feedback and analysis ideas
- Generative AI tools - Claude, Perplexity, Gemini, ChatGPT
- Google instructors - Data Analytics Certification program
- R, GitHub, and Quarto community - tools and resources
- U2 & crew - for their inspiring musical journey!
Thank You!
- I hope it was interesting for you
- Let me know what you think!
- E-mail | LinkedIn | X-Twitter
- Have a Beautiful Day, Don’t Let it Get Away!
Wipe / arrow down for my project links
U2 Data Analytics Project Links
- Project Website
- Project GitHub Repository
- Custom concertData R Package Repository
- Custom concertData R Package Documentation
- U2 Tour Map Shiny App
- Project Certification Badge - Google - Coursera